

Kicking off the year and debuting the quarterly schedule of our Streaming Recap series, we can assure you that while we may be zooming out, we’re certainly not holding back.
- January – $1.066B
- February – $1.03B
- March – $1.08B
The journey wasn’t linear with a slight dip in February. And March’s total did not surpass the 2023 record of $1.13B set in December, but it was nearly equivalent to our November total.
Top platforms
As for platform spend, the first quarter of this year was superior to the one prior with a near-18% increase—when excluding the two platforms that we did not track for that full duration in 2023 (Disney+ and Crackle).
2024: Ad spend by platform YOY
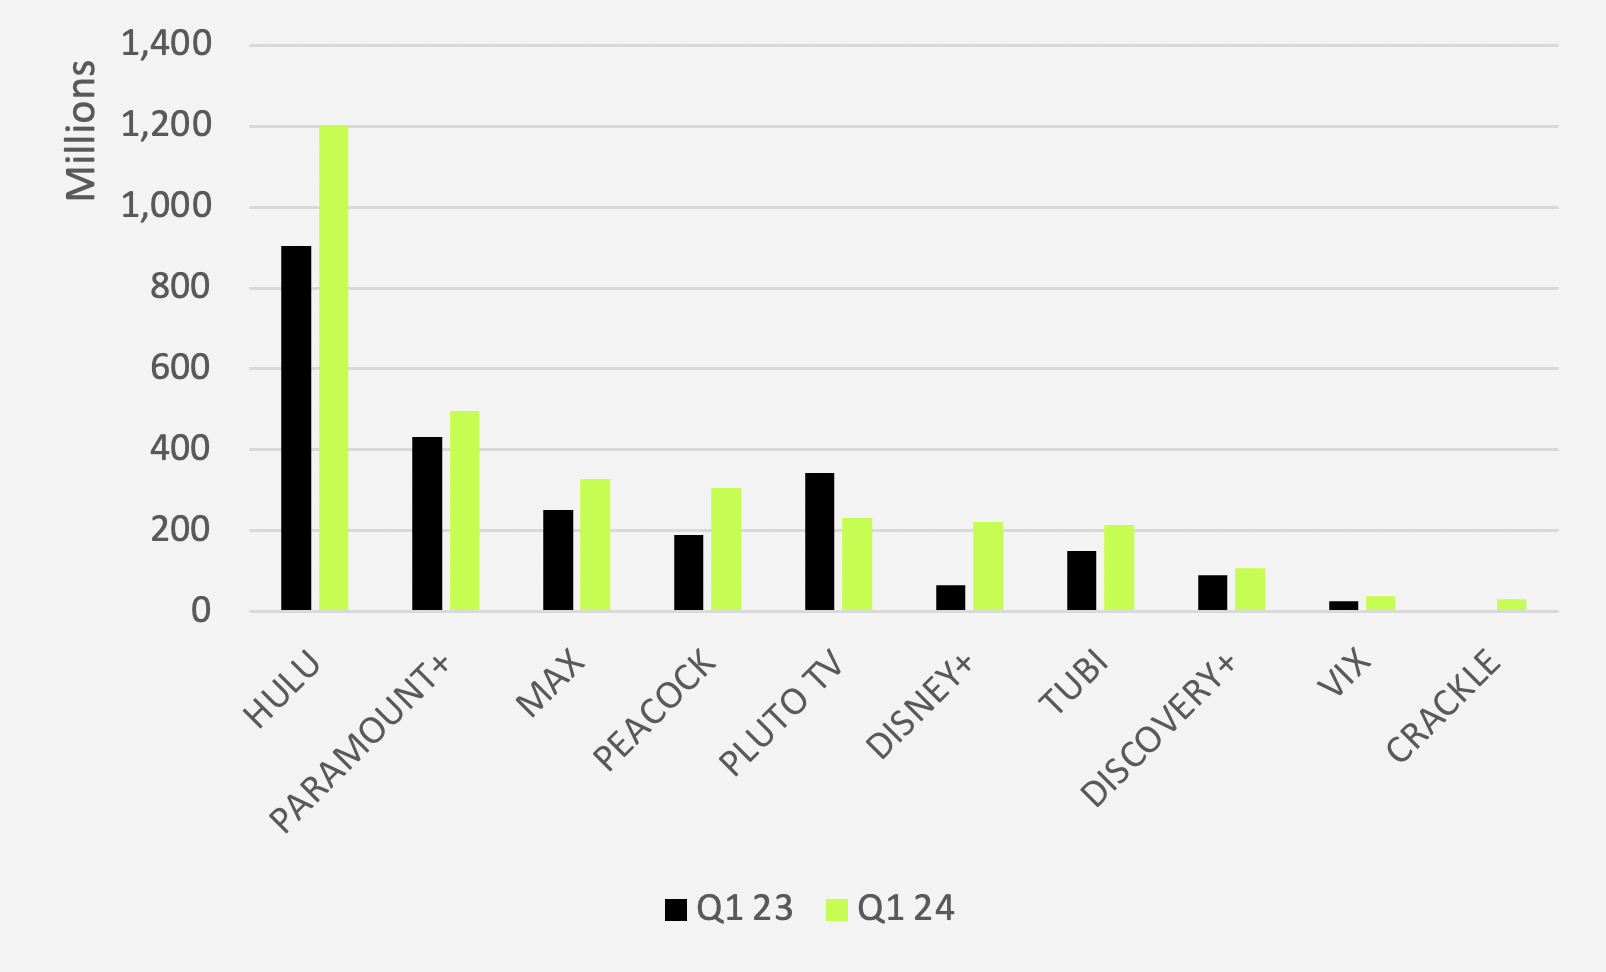
Source: Vivvix. Note: Vivvix began tracking Disney+ spend in March 2023 and Crackle spend in August 2023.
“Superior” is an especially relevant descriptor for long-time leader Hulu, which collected an impressive $1.2B dollars to claim almost 38% of our total, with a 33% growth rate YoY.
However, Peacock’s performance was remarkable. The platform secured a 61% increase YoY from $190M in Q1 2023 to more than $306M in 2024.
Pluto TV data displays the only decrease in dollars—with a contrast of $342M in Q1 2023 to $233M in Q1 2024. Industry spend will reveal why the latter total was low, which we’ll dive into in our white spaces analysis.
Also see monthly totals—generally consistent with the overall Q1 spend report.
Q1 2024: Ad spend by platform MOM

Source: Vivvix
- Platform spend increased by nearly 18% in the first quarter of this year compared to the previous year, excluding Disney+ and Crackle
- Hulu led with $1.2B in revenue, representing almost 38% of the total spend and a 33% year-over-year growth
- Pluto TV experienced a decline in revenue from $342M in Q1 2023 to $233M in Q1 2024
Leading industries
2. Food and beverage
3. Financial and Insurance
Hulu was by and large the dominant platform for Non-Rx Remedies and Apparel in Q1, capturing over 54% and 66%, respectively, of the industries’ $156M and $40M totals.
Hulu was also the preferred choice of leaders Restaurants and Food and Beverage as they invested $137M and $125M there.
Financial and Insurance advertiser dollars comprised more of Tubi’s total than any other industry with an investment of $43.6M—20.4% of the platform’s total revenue.
Pharmaceuticals advertisers directed 15% of total industry spend toward Peacock—a higher percentage than any other industry placed on the platform at almost $26M total.
- Hulu captured over 54% of Non-Rx Remedies' $156M total ad spend and 66% of Apparel's $40M
- Restaurants and Food and Beverage invested $137M and $125M, respectively, in Hulu
- Financial and Insurance accounted for 20.4% of Tubi's revenue with a $43.6M investment
Q1 2024: Industry rankings
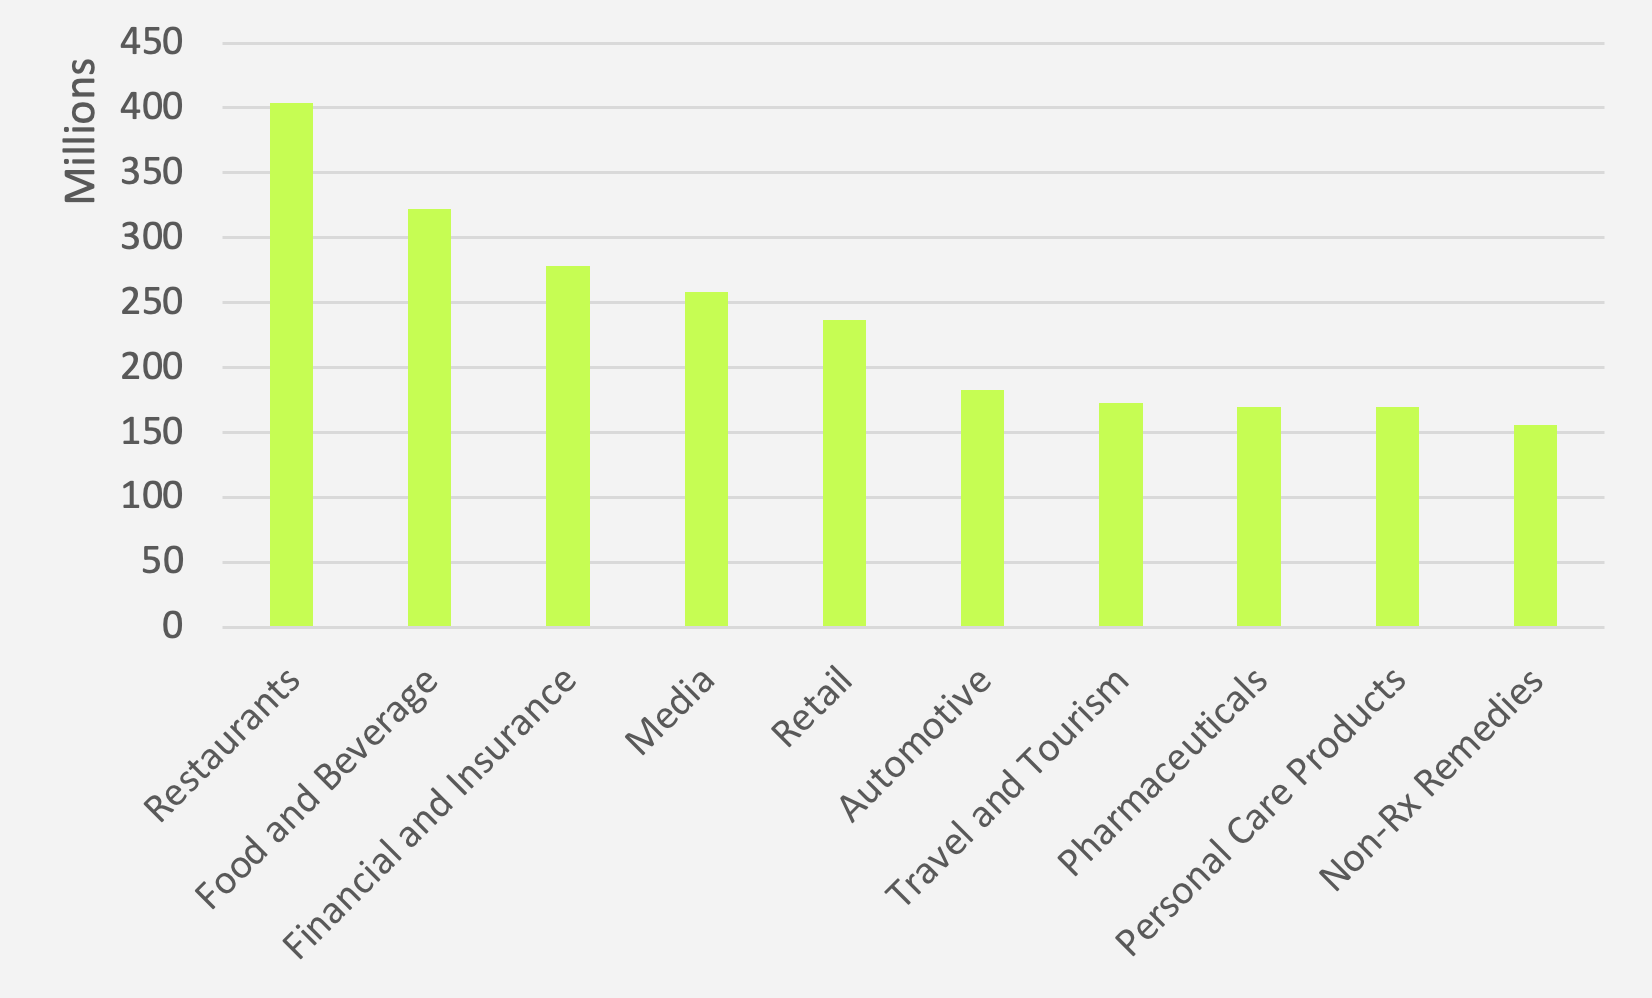
Source: Vivvix
Top spenders
2. Intuit
3. McDonald's
The 20 top-spending advertisers across our 10 platforms spent a total of $561M in Q1 of this year, amounting to just about 18% of total Q1 spend.
Capital One spent 11.3% of their total on Crackle—a significant portion compared to their spend on other platforms, besides MAX and Hulu.
Eli Lilly directed 9.4% of their streaming spend toward Discovery+, showing more interest in the platform than most other advertisers did. Wendy’s and pharmaceutical company Amgen invested slightly more of their totals for 15.5% and 16.9%.
Despite landing in third for total platform spend, McDonald’s placed only 4.6% of that total on Peacock—a comparatively low percentage amongst other top-spending advertisers that caused them to rank 14th on the list of Peacock investors.
Crest was the only top-20 advertiser to spend zero dollars on Peacock, also neglecting other platforms entirely, yet spending 40% of their total on Pluto TV.
- The top 20 advertisers spent a total of $561M in Q1, which is about 18% of total Q1 spend
- Capital One allocated 11.3% of their budget to Crackle—a significant portion compared to their spend on other platforms
- McDonald's invested only 4.6% of their total spend on Peacock, ranking 14th among Peacock investors
Source: Vivvix
Source: Vivvix
Streaming vs. linear
In Q1, Burger King ruled the ranks with their 41% AVOD investment amongst our combined AVOD/linear top-spenders while Taco Bell went for 34.4%.
Not included in our December 2023 rankings, Intuit jumped into the mix by upping their total combined spend, and their AVOD dedication reached a sizable 23.6%.
Relatively high on our list in the past with a healthy AVOD investment, AT&T tumbled as that percentage decreased to just 3.2%.
Q1 2024: Top 20 brands with highest combined streaming and linear spend (ranked from most to least in AVOD spend)
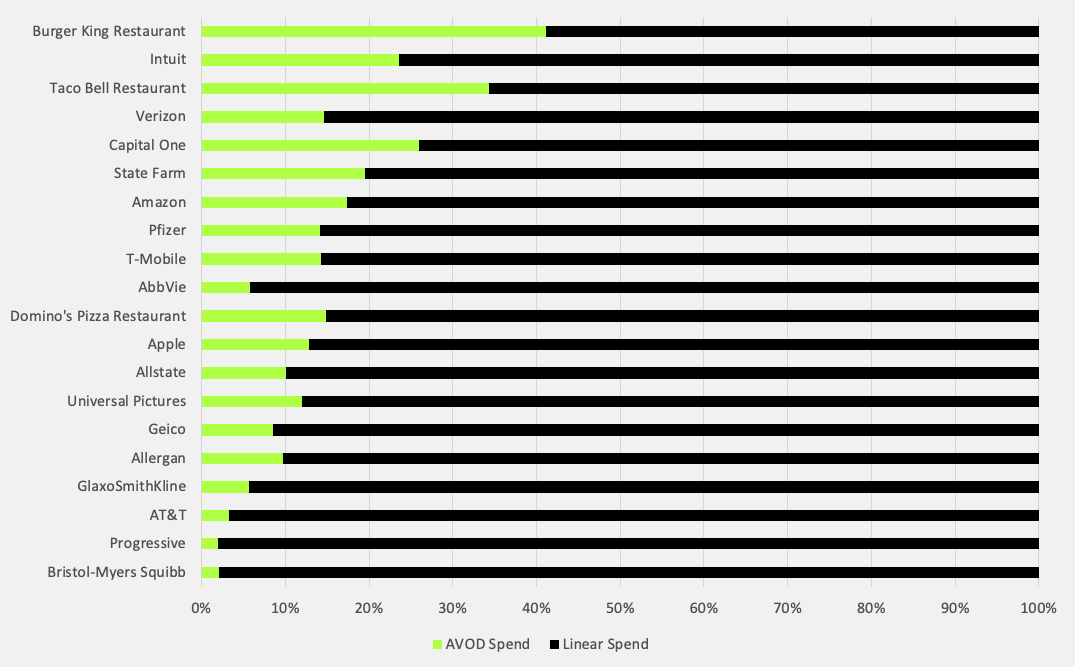
Source: Vivvix
Where's the white space?
As we mentioned, Pluto TV had a slower first quarter in 2024 than in 2023, so we’ll provide some insight into why that may be the case in terms of low spenders.
The big spenders in Financial and Insurance dedicated just 5.5% of their total, or $15.4M, to the platform. This likely impacted Pluto TV’s total Q1 ad revenue heavily, as the industry ranked third overall.
Travel and Tourism advertisers spent only 3% of their total there—$5M, which was considerably less than they spent on most other platforms.
Lastly, Electronics advertisers spent 2.4%—less than $1.5M—on Pluto TV, a lesser contribution than they made toward any platform but Discovery+ and Crackle.
There were also some exceptionally low share percentages across industries on other platforms that indicate opportunity in the space:
- Crackle – Food and Beverage (0.007%)
- VIX – Education (0%)
- Discovery+ – Restaurants (2%)
- Tubi – Travel and Tourism (0.7)
- Disney+ – Personal Care Products (2.8%)
Brands in these industries may want to seek opportunities to infiltrate these spaces and capture audiences’ attention to gain a leg up on competitors that aren’t utilizing the platforms.
CTV/STREAMING INTEL
Each quarter, we’ll share the latest insights, including spend, trends, and creativity in one of the most competitive landscapes to date. Stay tuned as we #FreeTheData.
Want access to streaming data and breaking creatives? Contact us here.