
We watched platform pandemonium ensue in 2023 as industries and advertisers battled it out to win attention from their target audience.
Each month we tracked those trends in our Streaming Recap series, calling out the shifting proclivities of streaming strongholds and novices alike—the highs, the lows, the predictable moves and the ones that surprised us.
With $10.85B dedicated to the eight platforms we’ve tracked since 2022 and a 32.4% growth rate amongst them year-over-year, the numbers are compelling.
And so, it’s due time we bring you one conclusive, comprehensive look at the year at the most opportune time. Let our data be the compass on your journey to capture the attention of the masses.
Top platforms
Vivvix has tracked over $26B in Advertising-Based Video On Demand (AVOD) ad dollars since we began monitoring streaming spend, indicating a remarkable surge in the fastest-growing media type.
With the AVOD sector becoming more crowded with platforms, brands, and spend, publishers are now attracting a broader array of advertisers.
2023: Ad spend by platform YOY
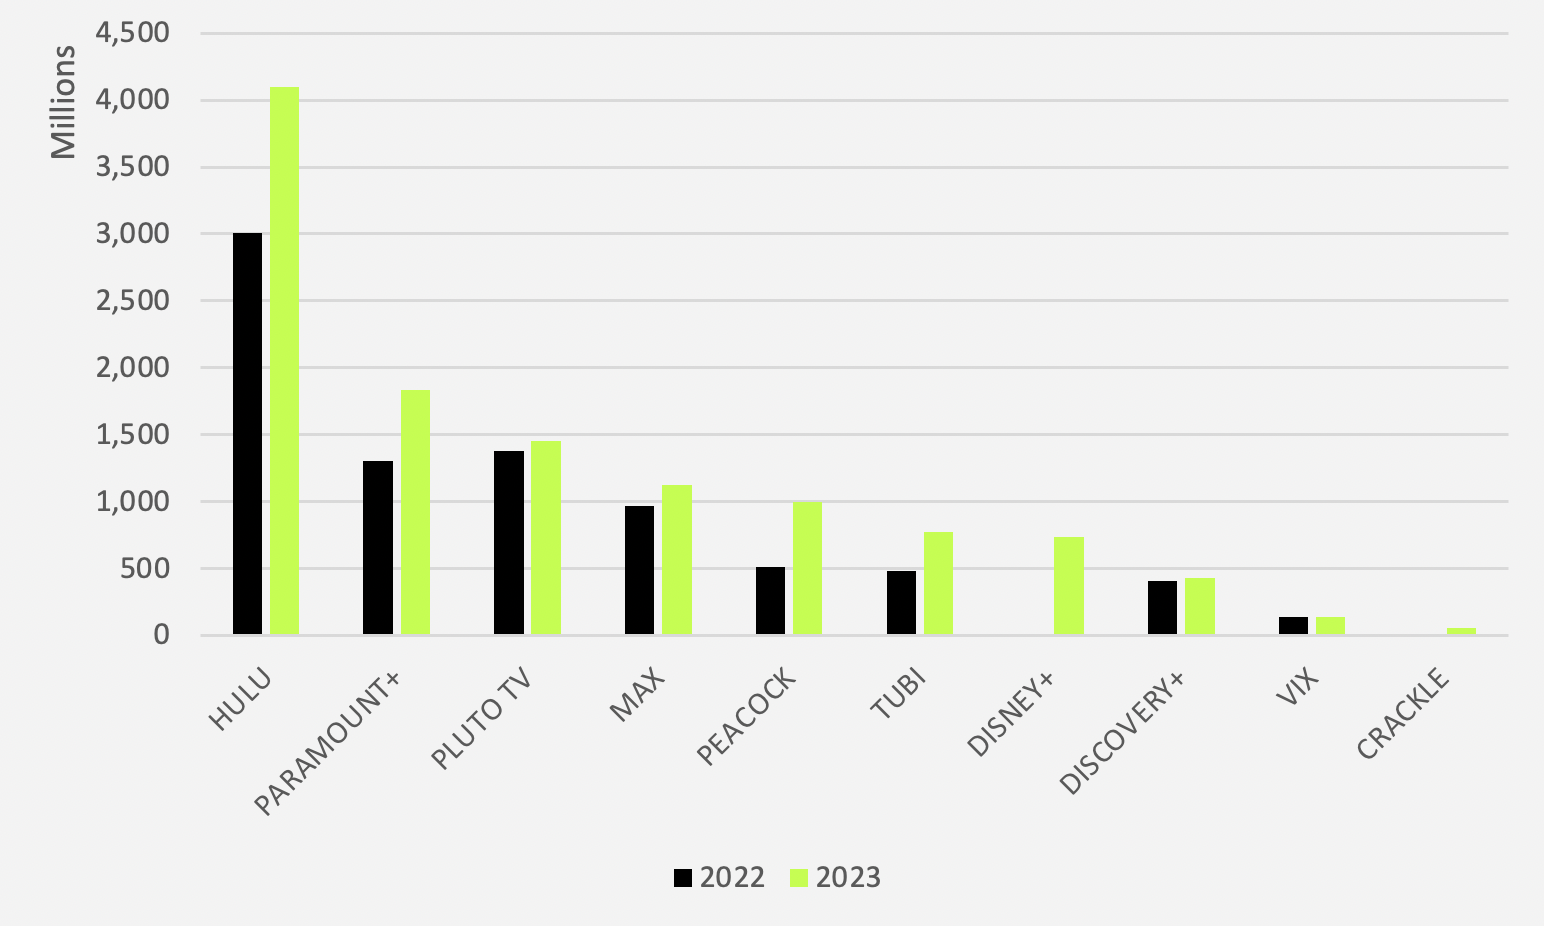
Peacock is distinguished by outpacing the category with a 93.5% growth rate year-over-year from 2022, while Hulu's dominance remains even as brands expand their investment across diverse platforms.
For example, Tubi experienced the second-highest growth rate at 61.6%, followed by Paramount+ at 40.4%, then Hulu at 36.2%. MAX (up 16.2%), Discovery+ (up 6%), Pluto TV (up 5.7%), and Vix (up 1.3%) experienced less substantial growth.
2023: Ad spend share by platform
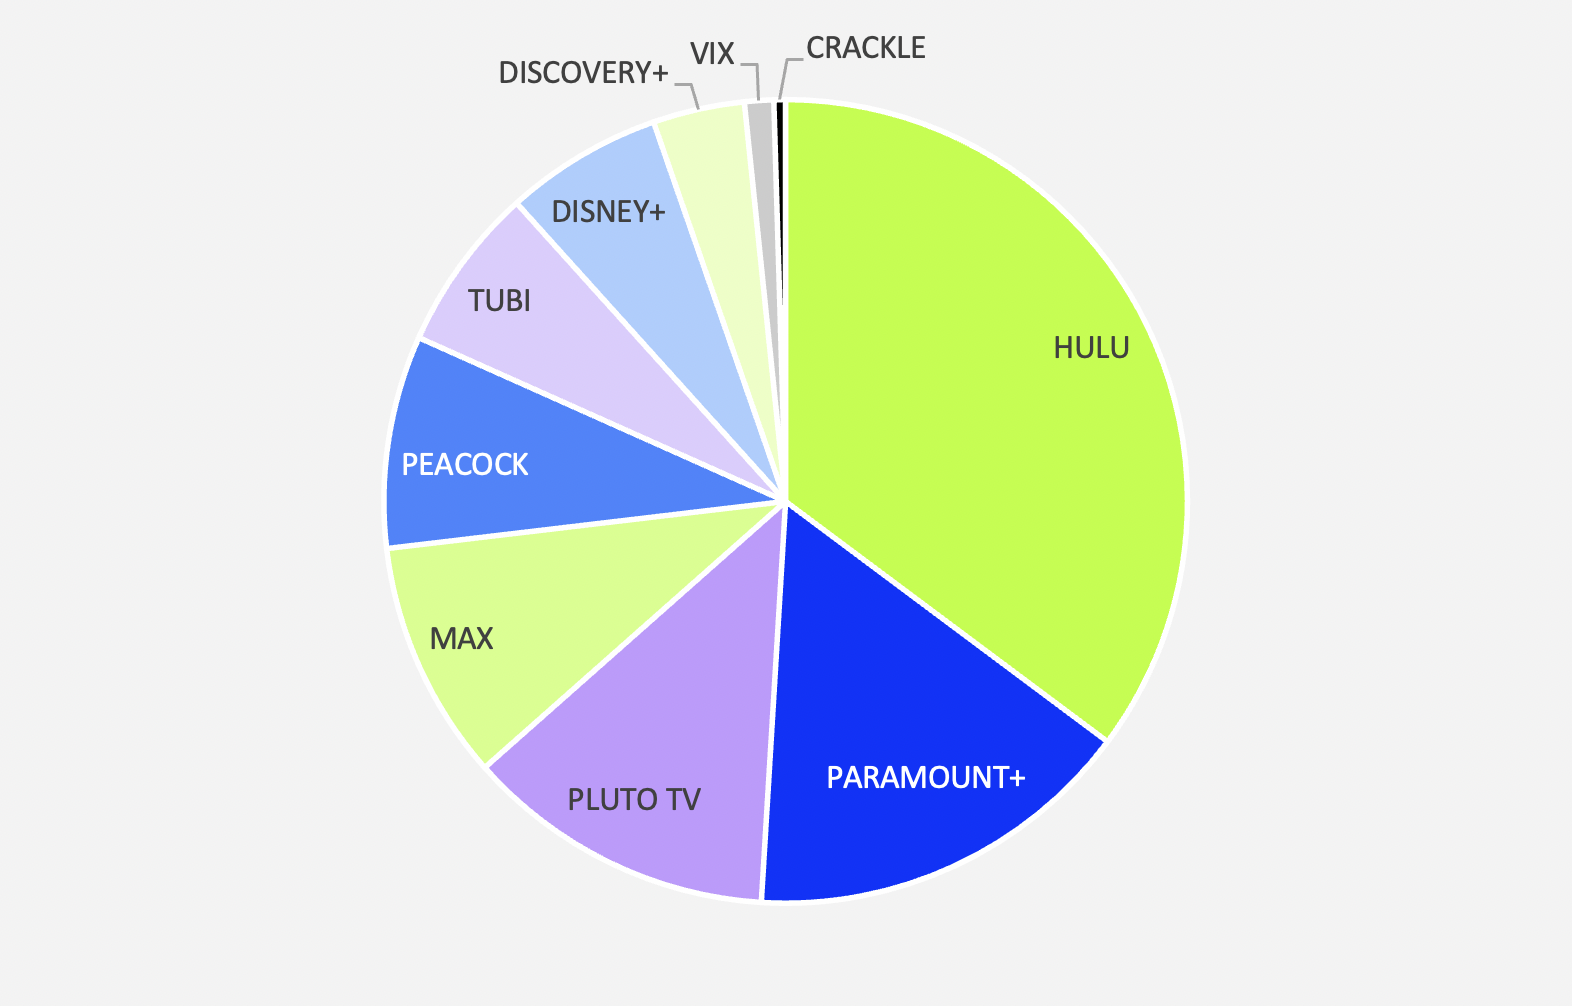
| Hulu | 35.2% |
| Paramount+ | 15.8% |
| Pluto TV | 12.5% |
| MAX | 9.7% |
| Peacock | 8.6% |
| Tubi | 6.6% |
| Disney+ | 6.3% |
| Discovery+ | 3.7% |
| Vix | 1.2% |
| Crackle | 0.5% |
Source: Vivvix. Note: Vivvix began tracking Disney+ spend in March 2023 and Crackle spend in August 2023.
2023: Total ad spend by month
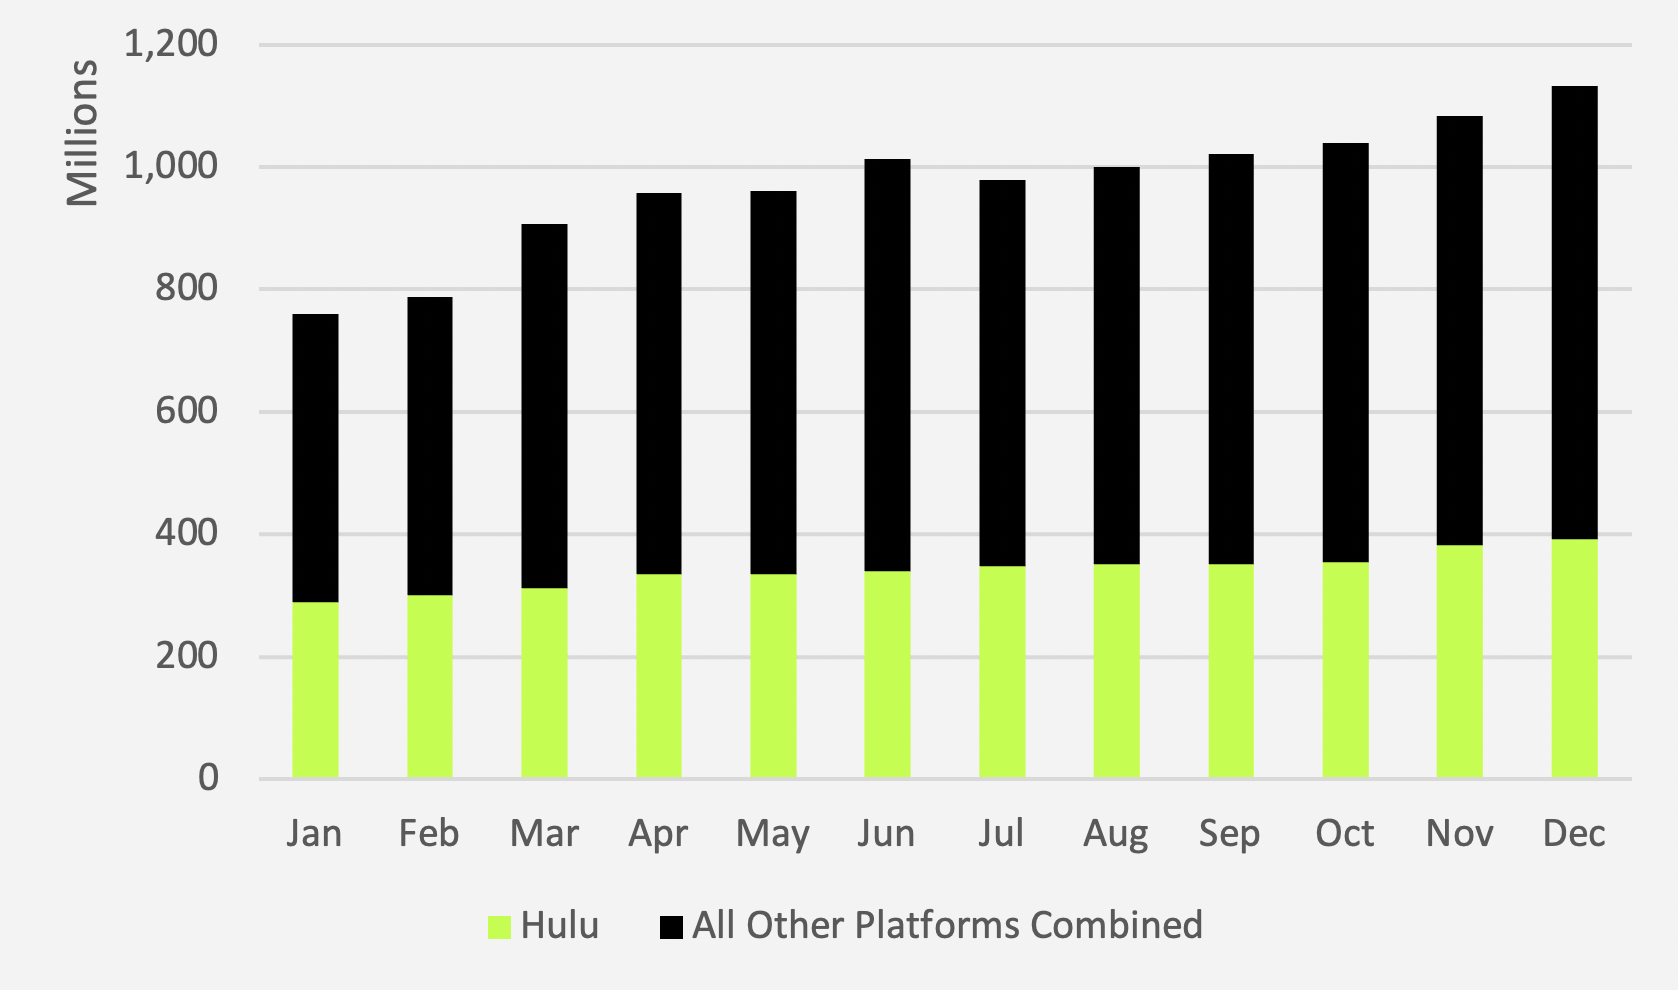
Total spend did not have a linear ascent from start to finish of the year due to $1B milestone in June. As for heavy-hitter Hulu, there was steady, gradual growth from January to December.
All in all, clear upward momentum was the theme of 2023, keeping us inclined to anticipate a similar trend in 2024.
Leading industries
Our analyses included 25 different industries in each month of 2023, and we saw fluctuations large and small through it all. No matter your niche, we can only stress that the race is on—and it’s a close one.
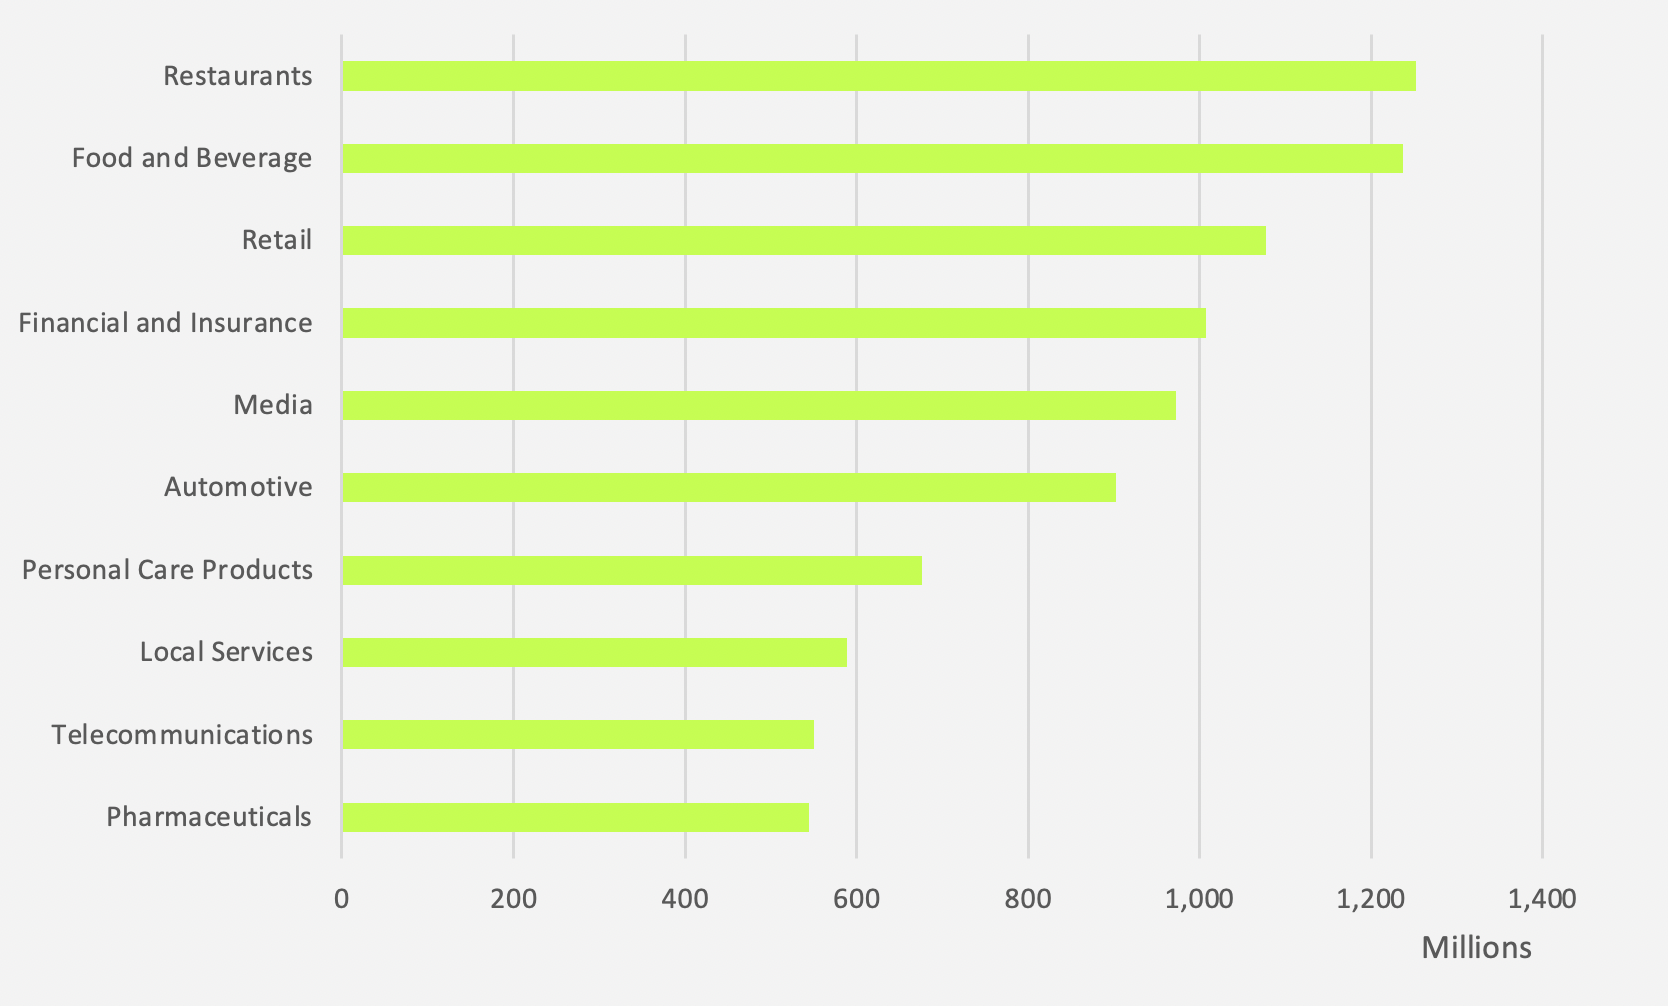
Restaurants, food and beverage, and retail were the three top-spending industries with respective shares of 10.8%, 10.6%, and 9.2% of grand total CTV investment for 2023.
Household building materials and fixtures, office equipment and manufacturing, and energy were the three lowest-spending industries with shares of 0.06%, 0.02%, and 0.003%.
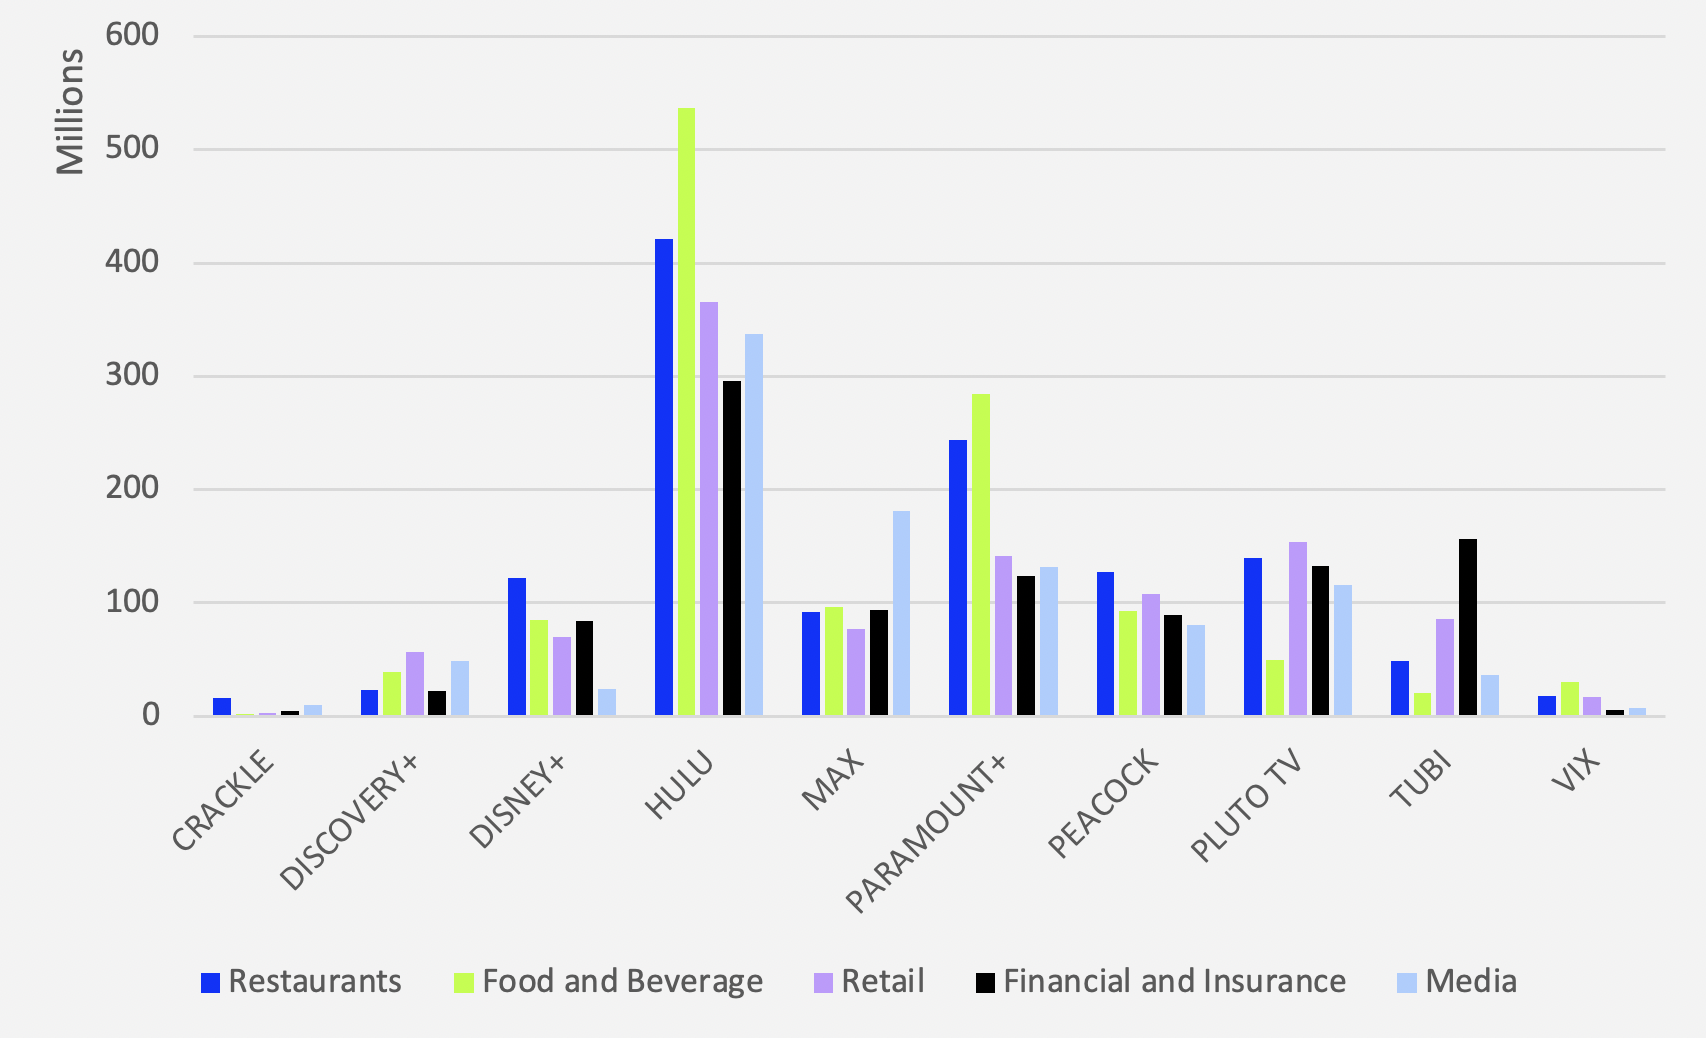
Our top industry of 2023—restaurants—took the lead on Disney+ with a 16.6% share. Peacock had a 12.8% share.
Food and beverage commanded Hulu with 13.1% of the platform's total spend throughout the year. Paramount+ claimed 15.5%.
As for our third-slot industry, retail narrowly bested the rest on Pluto TV, providing 10.5% of that total revenue.
Top spenders overall
2. McDonald's
3. State Farm
5. T-Mobile
6. Capital One
8. Walmart
9. AbbVie
11. Chime Bank
12. Chevrolet
14. Apple
15. Taco Bell
17. Hyundai
19. Toyota
20. Peloton
This tenacious top 20 amassed $1.95B total in CTV dedications to our top 10 platforms throughout 2023, which is 16.8% of our grand total.
Digital native Amazon was a lock for the first slot, holding fast to 1.3% of said grand total while McDonald’s secured nearly 1.1%. State Farm wasn’t far behind with 1.05%.
See some of the top-dollar ads of the year.
Source: Vivvix
Where's the white space?
Whether you call it “white space,” “steal share,” or a “revenue opportunity,” the impetus of our ad intel is competition—we aim to show you where your brand can compete. And there were a few arenas left wide open by various industries in 2023.
Ranked first overall, restaurant advertiser spend accounted for just $48.5M or 6% of all Tubi spend. Food and beverage advertiser spend was relatively low with Pluto TV as they invested just 3.4% of the platform’s total. As for MAX, only 6.8% of its total share came from retail advertisers.
But which other industries had low share percentages per certain platforms?
- Pluto TV – Travel and tourism (1.1%)
- MAX – Household supplies and cleaners (0.2%)
- Peacock – Apparel (0.6%)
- Tubi – Pharmaceuticals (0.6%)
- Discovery+ – Telecommunications (0.8%)
- Vix – Financial and insurance (3.7%)
- Crackle – Personal care products (0.1%)
2023 streaming spend was unmatched, and such volume could seem daunting. But getting started or breaking through is as easy as knowing where to play.
A final word
In 2023 there were $1B milestones crossed in June and December (yes, two separate inflection points to note). There were bold selections by big-name brands. And there were new additions to our pack of platforms.
It can be said that Vivvix announced an abundance of moments worth revisiting, so you can take a peek at our CTV resources to get further details, but—most importantly—be sure not to miss another monthly recap.
Follow us on LinkedIn and we’ll keep you up to speed as we cruise through 2024.
CTV/STREAMING INTEL
Each month, we’ll share the latest insights including spend, trends, and creative in one of the most competitive landscapes to date. Stay tuned as we #FreeTheData.
Want access to streaming data and breaking creatives? Contact us here.